*02/23/2022 UPDATE: Complete overhaul and re-post of The VIX & Days Between Volatility Spikes.
I. Introduction & Overview
II. Frequency Results
III. Magnitude Results
IV. Conclusion
I. Introduction & Overview
The goal of this study is to identify the length of time that tends to pass between VIX volatility spikes and the magnitude of those spikes. How much time tends to pass between each volatility spike? Is there any relationship to the magnitude of volatility spikes compared to the amount of time that passes? How has the magnitude of volatility spikes changed over the years?
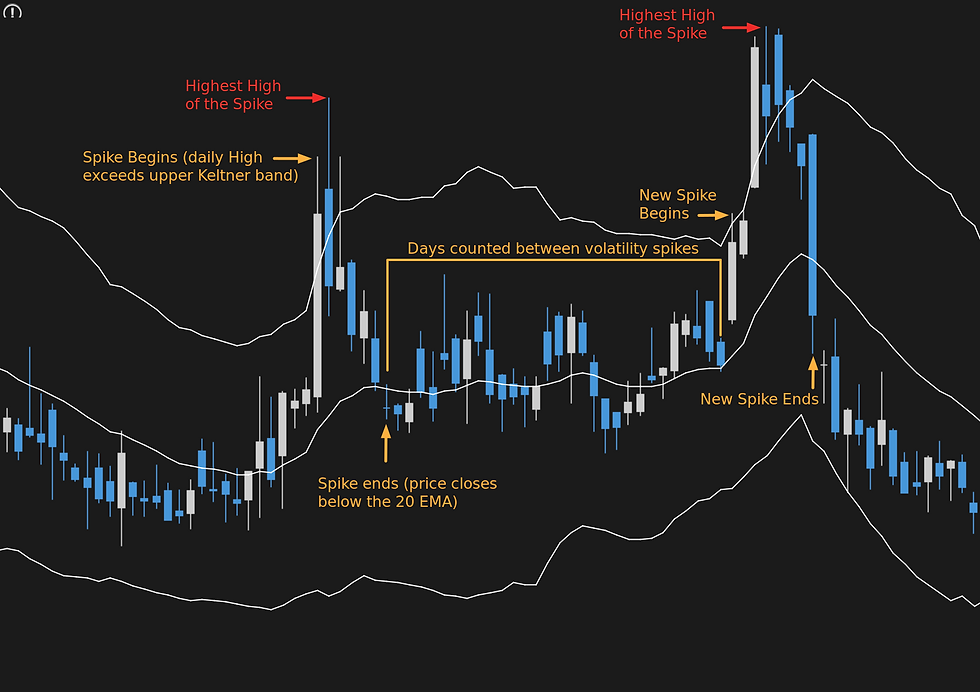
To classify volatility spikes, we use a Keltner Channel with a 20 Exponential Moving Average (EMA) and a 2.25 Simple Average True Range (ATR) multiplier. These Keltner Channels are calculated by plotting a 20 EMA and creating an upper and lower band that are 2.25 ATR(20) away from the moving average. This is significant because it help to detect fast, volatile deviations from a specific mean. Distance and deviations from a mean is shown to be significant in a variety asset classes (see https://www.leewenmarketstats.com/post/mean-reversion-distance-study).
The beginning of a volatility spike will be signaled when the daily High exceeds the upper Keltner band and the end of the spike is signaled when price closes below the 20 EMA. Then, we will count the number of days that occur until the next volatility spike occurs. The magnitude of the spike is measured by taking the percent change of the highest High from the closing price before the spike began. Below is a visual example of these test conditions:

This backest will be be performed on a daily timeframe and will begin on 01/01/2003.
II. Frequency Results
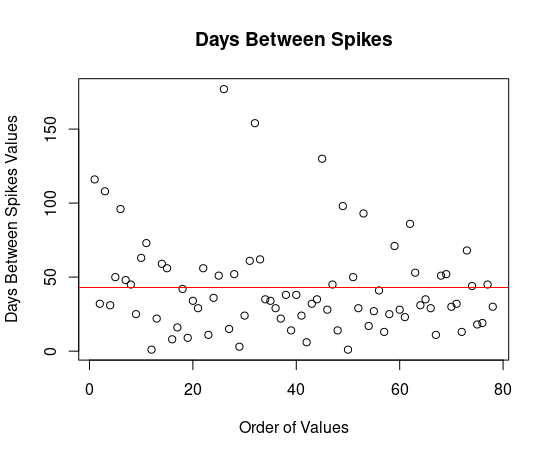
When producing a scatterplot of the the days between each volatility spike, we receive the following output. The red line marks the mean.

There does not seem to be any patterns in the timing of these spikes, but we can definitely see a distribution form. Below is a histogram for a clearer visual:

The results are Negative Binomial distributed with fairly high degrees of skewness and kurtosis; not surprised, as the VIX derives from equity derivatives after all. If daily closes rather than highs are used to categorize a VIX spike, returns become almost Poisson distributed. This distribution shifts with different Keltner Channel parameters, but remains Negative Binomially distributed with little improvement to be found in skewness and kurtosis. Distribution fit could potentially be improved with a different methodology for classifying a volatility spike and is suggested if to be included in any formal analysis systems.
III. Magnitude Results
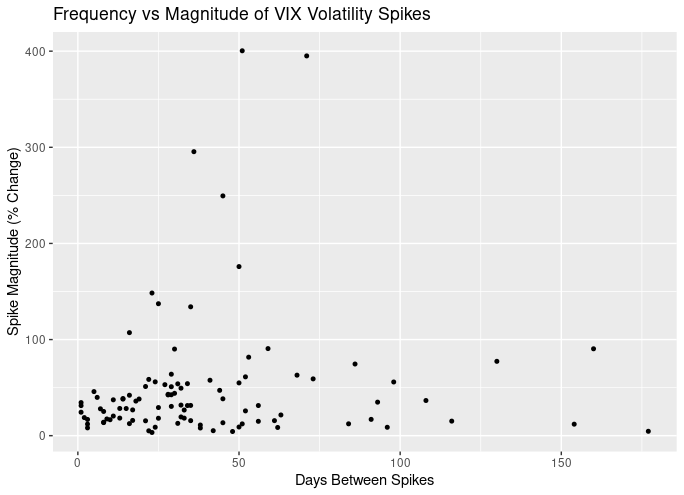
Is there any relationship to the magnitude of volatility spikes compared to the amount of time that passes? Do volatility spikes get more drastic as the time since the previous spike lengthens?
From the plot below, it is evident that there is no relationship between the amount of time that passes compared to the magnitude of the volatility spike:

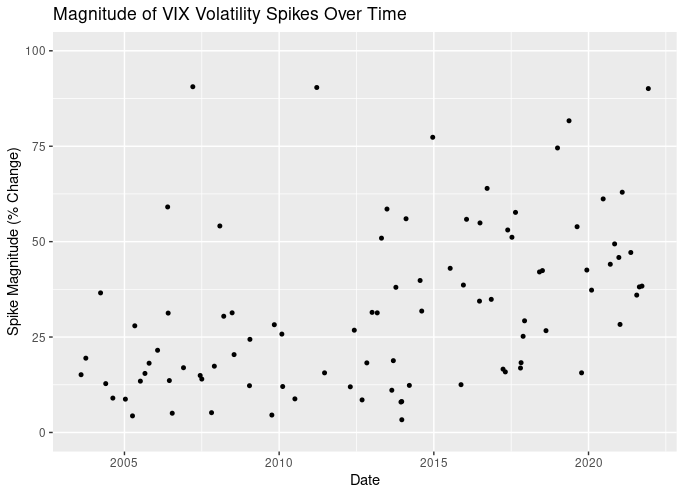
Taking the logarithm of Spike Magnitude also revealed that there is no relationship and spike magnitude appeared random. When plotting Spike Magnitude over time from 2003 to Feb 2022, the following results are obtained:

There appears to be a slight increase in the cluster of spike magnitudes over time. When setting a Y-axis limit to 100, the blatant outliers are removed from the plot and the data is clearer:

It appears that since 2015, the average magnitude of VIX volatility spikes increased. At this time, there were concerns in equities markets due to multiple interest rate raises incoming; this sounds similar to Q1 2022. If the average volatility spike's magnitude increased, this can also increase the expected outcome of trade structures that benefit from increasing Implied Volatility, such as Long Puts.
IV. Conclusion
The frequency of VIX volatility spikes is Negative Binomially distributed. Distribution fit may be improved through other methods of classifying a VIX spike; changing the parameters of the Keltner Channels did not improve or worsen the distribution fit significantly. There was also no relationship found between the number of days that pass since the lasts VIX volatility spike and the magnitude of those spikes. In other words, the amount of time passed is not a significant variable in predicting the magnitude of volatility spikes. However, when analyzing the magnitude of volatility spikes over time, there was an immediate increase in the cluster of data points after 2015. This is hypothesized to be due to fears in equities markets from expected interest rate raises. Q1 2022 shares these same concerns, so trade structures that benefit from increasing Implied Volatility, such as Long Puts, may have increased expected outcomes compared to years prior.

Comments