*01/18/2022 UPDATE: This post is a complete overhaul and re-post of Monthly Price Statistics from 12/12/2020
I. Introduction & Overview
II. Returns & Volatility: Month-to-Month
III. Returns & Volatility: Day-to-Day Inner-Month
IV. Distribution Analysis
V. Conclusion
I. Introduction & Overview
There have been many claims about how the market tends to perform or behave depending on the calendar month. The purpose of this study will be to compare and evaluate differences in returns and volatility on month-to-month and day-to-day timeframes. This backtest will analyze the SPDR S&P 500 ETF Trust (SPY) and will begin on 01/01/2003.
First, we will analyze a month-to-month timeframe to identify any statistical significance in means returns (percent changes in price) and volatility. Then, the same will be done for a day-to-day timeframe to track any significance in "inner-month behavior." Benchmark p-values will be calculated by comparing observations in a particular month or days in a particular month against those of any other. Since it is appropriate, equal variance will be assumed in all significance tests. Volatility will be measured as True Range as a Percentage (TRP in the tables), which is essentially the True Range (TR) divided over the period's closing price to allow fair volatility comparisons by accounting for large increases or decreases in price over time.
Following the results, we will analyze the returns and volatility distributions to see how they differ month-over-month.
II. Returns & Volatility: Month-to-Month
When analyzing month-to-month returns and volatility, we get the following result:

As we see, mean returns (or average percent changes) vary from month to month, but only one month holds statistical significance: April, which also has the highest mean return and "Green Frequency" (win rate). It is commonly said that April is typically a booming month. Low p-values are also found in Invesco's QQQ, suggesting that the claims about "tech booming in April" seems to have some validity.
It should also be noted that while not statistically significant, the True Range Percentage (TRP) column report higher significance in volatility for June and July, where those summer months seem to be more calm. Volatility is more appropriately measure on a day-to-day basis and is evaluated in the next section.
It should be noted that changing the backtesting period can have a strong effect on the reports of statistical significance since sample sizes are small.
III. Returns & Volatility: Day-to-Day Inner-Month
In order to understand the significance of tracking day-to-day price changes and volatility inside of each month, we'll think of it this way: performance is simply the sum of all outcomes of probability. Significant differences in the overall day-to-day returns or volatility distributions can give us further insight than just using monthly timeframe data.
When analyzing day-to-day returns and volatility grouped by month, we get the following result:

While there is no statistical significance found in mean returns (or percent change in price), there does seem to be significance found in volatility. Day-to-day volatility in the months on March, June, July, October, and December all report statistical significance. March and October reported high volatility while June, July, and December reported low volatility.
IV. Distribution Analysis
Now we will analyze the returns distribution for each month:
Returns usually tend to be fairly normally distributed. As we can see with some of the results, skewness and kurtosis tend to be extremely high. This is not surprising, as this is usually the case for distributions when dealing with equities. Some months have incredible outliers, such as March due the COVID-19 crash or December and the 2008 Great Financial Crisis. These extreme events create heavy tails that contribute to overall skewness and kurtosis in equities in general, not just in a month-to-month analysis. It is arguable that these extreme events are solely due to fundamental, macro-economic events, so what and how you decide to deal with these outliers is up to you.
It is clear that July has the most normality with the least amount of skewness and kurtosis (also measured, not just shown empirically).
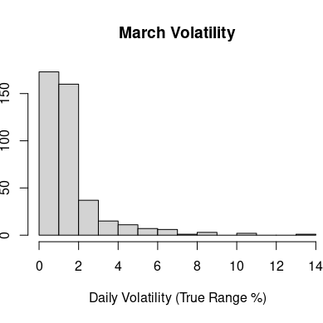
We will now analyze the volatility distribution for each month, using the True Range % form of measurement:
Since we are using a True Range % form of measurement, rather than the traditional rolling StdDev, the distributions are Gamma distributed with some degree of skewness and kurtosis. When analyzing each distribution, it was found that July once again had the best fit and the least amount of skewness and kurtosis. Is this because no extreme event has ever happened in July, just by chance? Is it because there is something about the calendar month of July itself?
V. Conclusion
With high overall mean returns in April, high day-to-day volatility in March, and low day-to-day volatility in June, July, and December, there does in fact seem to be a degree of monthly seasonality in equity markets. July reported the cleanest and best-fit distributions for returns and volatility. However, I would be cautious to act or create strategies solely on front-running the calendar month. Results can easily heavily be skewed by extreme events. Are these results skewed solely occur due to fundamental, macro-economic events that have no relation to the calendar month? Or is there really a degree of seasonality?
My initial thought is this cannot be a standalone strategy. If there is any sort of returns or volatility seasonality, it should be approached with a hypothesis of why. I fail to find any hypothesis on the cause, besides some ideas such as FOMC meeting months. In that case, it is no longer a study of comparing calendar months, but now a study of events, which is are studies for another time.


Comments